December 17, 2020 – Another 1.3 million people applied for Unemployment Insurance (UI) benefits last week, including 885,000 people who applied for regular state UI and 455,000 who applied for Pandemic Unemployment Assistance (PUA). The 1.3 million who applied for UI last week was an increase of 63,000 from the prior week. This was the second week in a row of increases and initial claims are now back to their highest point since September. Layoffs are rising as the COVID-19 virus surges and demand weakens. And, last week was the 39th straight week total initial claims were greater than the worst week of the Great Recession. (If that comparison is restricted to regular state claims—because we didn’t have PUA in the Great Recession—initial claims last week were greater than the second-worst week of the Great Recession.)
Most states provide 26 weeks (six months) of regular benefits. Given the length of this crisis, many workers have exhausted their regular state UI benefits. In the most recent data, continuing claims for regular state UI dropped by 273,000. For now, after an individual exhausts regular state benefits, they can move onto Pandemic Emergency Unemployment Compensation (PEUC), which is an additional 13 weeks of regular state UI. However, PEUC is not rising as fast as continuing claims for regular state UI are dropping. Why? Many of the roughly 2 million workers who were on UI before the recession began, or who are in states with less than the standard 26 weeks of regular state benefits, are now exhausting PEUC benefits, at the same time others are taking it up. The Department of Labor reports that nearly 2 million workers have exhausted PEUC so far—and that is a vast undercount because many states have not yet reported PEUC exhaustions past October (see column C43 in form ETA 5159 for PEUC here).
In some states, if workers exhaust PEUC, they can get on yet another program, Extended Benefits (EB). However, in the latest data, just 694,000 workers were on EB. That’s likely less than a third of those who have exhausted PEUC. Most are left with nothing.
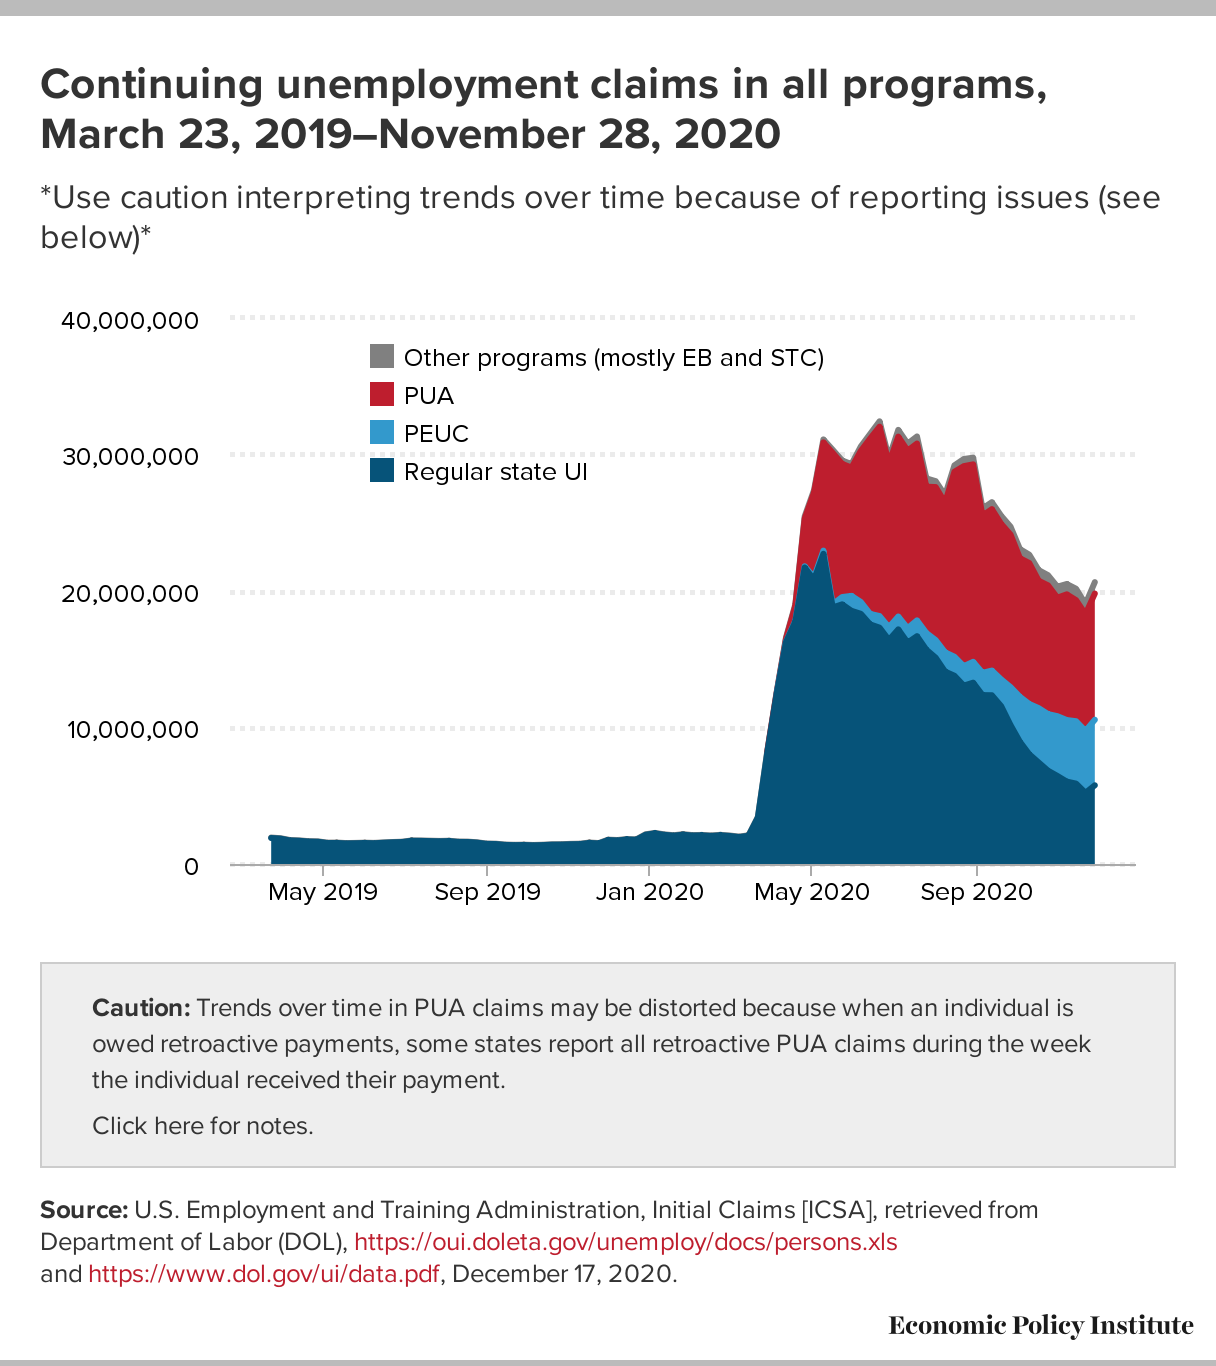
Figure A shows continuing claims in all programs over time (the latest data are for November 28). Continuing claims are still more than 18 million above where they were a year ago and are the highest they’ve been since mid-October, even with the exhaustions we’ve seen so far.FIGURE A
Continuing unemployment claims in all programs, March 23, 2019–November 28, 2020*Use caution interpreting trends over time because of reporting issues (see below)*
| Date | Regular state UI | PEUC | PUA | Other programs (mostly EB and STC) |
|---|---|---|---|---|
| 2019-03-23 | 1,905,627 | – | – | 31,510 |
| 2019-03-30 | 1,858,954 | – | – | 31,446 |
| 2019-04-06 | 1,727,261 | – | – | 30,454 |
| 2019-04-13 | 1,700,689 | – | – | 30,404 |
| 2019-04-20 | 1,645,387 | – | – | 28,281 |
| 2019-04-27 | 1,630,382 | – | – | 29,795 |
| 2019-05-04 | 1,536,652 | – | – | 27,937 |
| 2019-05-11 | 1,540,486 | – | – | 28,727 |
| 2019-05-18 | 1,506,501 | – | – | 27,949 |
| 2019-05-25 | 1,519,345 | – | – | 26,263 |
| 2019-06-01 | 1,535,572 | – | – | 26,905 |
| 2019-06-08 | 1,520,520 | – | – | 25,694 |
| 2019-06-15 | 1,556,252 | – | – | 26,057 |
| 2019-06-22 | 1,586,714 | – | – | 25,409 |
| 2019-06-29 | 1,608,769 | – | – | 23,926 |
| 2019-07-06 | 1,700,329 | – | – | 25,630 |
| 2019-07-13 | 1,694,876 | – | – | 27,169 |
| 2019-07-20 | 1,676,883 | – | – | 30,390 |
| 2019-07-27 | 1,662,427 | – | – | 28,319 |
| 2019-08-03 | 1,676,979 | – | – | 27,403 |
| 2019-08-10 | 1,616,985 | – | – | 27,330 |
| 2019-08-17 | 1,613,394 | – | – | 26,234 |
| 2019-08-24 | 1,564,203 | – | – | 27,253 |
| 2019-08-31 | 1,473,997 | – | – | 25,003 |
| 2019-09-07 | 1,462,776 | – | – | 25,909 |
| 2019-09-14 | 1,397,267 | – | – | 26,699 |
| 2019-09-21 | 1,380,668 | – | – | 26,641 |
| 2019-09-28 | 1,390,061 | – | – | 25,460 |
| 2019-10-05 | 1,366,978 | – | – | 26,977 |
| 2019-10-12 | 1,384,208 | – | – | 27,501 |
| 2019-10-19 | 1,416,816 | – | – | 28,088 |
| 2019-10-26 | 1,420,918 | – | – | 28,576 |
| 2019-11-02 | 1,447,411 | – | – | 29,080 |
| 2019-11-09 | 1,457,789 | – | – | 30,024 |
| 2019-11-16 | 1,541,860 | – | – | 31,593 |
| 2019-11-23 | 1,505,742 | – | – | 29,499 |
| 2019-11-30 | 1,752,141 | – | – | 30,315 |
| 2019-12-07 | 1,725,237 | – | – | 32,895 |
| 2019-12-14 | 1,796,247 | – | – | 31,893 |
| 2019-12-21 | 1,773,949 | – | – | 29,888 |
| 2019-12-28 | 2,143,802 | – | – | 32,517 |
| 2020-01-04 | 2,245,684 | – | – | 32,520 |
| 2020-01-11 | 2,137,910 | – | – | 33,882 |
| 2020-01-18 | 2,075,857 | – | – | 32,625 |
| 2020-01-25 | 2,148,764 | – | – | 35,828 |
| 2020-02-01 | 2,084,204 | – | – | 33,884 |
| 2020-02-08 | 2,095,001 | – | – | 35,605 |
| 2020-02-15 | 2,057,774 | – | – | 34,683 |
| 2020-02-22 | 2,101,301 | – | – | 35,440 |
| 2020-02-29 | 2,054,129 | – | – | 33,053 |
| 2020-03-07 | 1,973,560 | – | – | 32,803 |
| 2020-03-14 | 2,071,070 | – | – | 34,149 |
| 2020-03-21 | 3,410,969 | – | – | 36,758 |
| 2020-03-28 | 8,158,043 | – | 52,494 | 48,963 |
| 2020-04-04 | 12,444,309 | 3,802 | 68,897 | 64,201 |
| 2020-04-11 | 16,249,334 | 31,392 | 210,939 | 89,915 |
| 2020-04-18 | 17,756,054 | 59,760 | 1,088,281 | 116,162 |
| 2020-04-25 | 21,723,230 | 86,972 | 3,498,790 | 158,031 |
| 2020-05-02 | 20,823,294 | 171,580 | 6,226,074 | 175,289 |
| 2020-05-09 | 22,725,217 | 232,057 | 7,929,418 | 216,576 |
| 2020-05-16 | 18,791,926 | 233,288 | 11,095,269 | 226,164 |
| 2020-05-23 | 19,022,578 | 534,958 | 9,761,879 | 247,595 |
| 2020-05-30 | 18,548,442 | 1,093,338 | 9,392,718 | 259,499 |
| 2020-06-06 | 18,330,293 | 867,226 | 11,067,905 | 325,282 |
| 2020-06-13 | 17,552,371 | 769,155 | 12,853,484 | 336,537 |
| 2020-06-20 | 17,316,689 | 850,461 | 13,870,617 | 392,042 |
| 2020-06-27 | 16,410,059 | 936,726 | 12,008,146 | 373,841 |
| 2020-07-04 | 17,188,908 | 940,001 | 13,179,377 | 495,296 |
| 2020-07-11 | 16,221,070 | 1,055,778 | 13,008,659 | 513,141 |
| 2020-07-18 | 16,691,210 | 1,155,692 | 12,956,006 | 518,584 |
| 2020-07-25 | 15,700,971 | 1,223,255 | 10,717,042 | 609,328 |
| 2020-08-01 | 15,112,240 | 1,289,125 | 11,212,827 | 433,416 |
| 2020-08-08 | 14,098,536 | 1,407,802 | 10,957,527 | 549,603 |
| 2020-08-15 | 13,792,016 | 1,393,314 | 13,550,916 | 469,028 |
| 2020-08-22 | 13,067,660 | 1,422,483 | 14,656,297 | 523,430 |
| 2020-08-29 | 13,283,721 | 1,527,166 | 14,467,064 | 490,514 |
| 2020-09-05 | 12,373,201 | 1,631,645 | 11,510,888 | 529,220 |
| 2020-09-12 | 12,363,489 | 1,806,241 | 11,828,338 | 510,610 |
| 2020-09-19 | 11,561,158 | 1,959,953 | 11,394,832 | 589,652 |
| 2020-09-26 | 10,172,332 | 2,786,333 | 11,172,335 | 579,582 |
| 2020-10-03 | 8,952,580 | 3,296,156 | 10,152,753 | 668,691 |
| 2020-10-10 | 8,038,175 | 3,683,496 | 10,324,779 | 614,875 |
| 2020-10-17 | 7,436,321 | 3,983,613 | 9,332,610 | 778,746 |
| 2020-10-24 | 6,837,941 | 4,143,389 | 9,433,127 | 746,403 |
| 2020-10-31 | 6,452,002 | 4,376,847 | 8,681,647 | 806,430 |
| 2020-11-07 | 6,037,760 | 4,509,284 | 9,208,570 | 757,496 |
| 2020-11-14 | 5,890,220 | 4,569,016 | 8,869,502 | 834,740 |
| 2020-11-21 | 5,213,781 | 4,532,876 | 8,555,763 | 741,078 |
| 2020-11-28 | 5,766,130 | 4,801,408 | 9,244,556 | 834,685 |
Other programs (mostly EB and STC)PUAPEUCRegular state UIJan 2020Jul 2019Jul 2020010,000,00020,000,00030,000,00040,000,000ChartDataCaution: Trends over time in PUA claims may be distorted because when an individual is owed retroactive payments, some states report all retroactive PUA claims during the week the individual received their payment.
Click here for notes.
Source: U.S. Employment and Training Administration, Initial Claims [ICSA], retrieved from Department of Labor (DOL), https://oui.doleta.gov/unemploy/docs/persons.xls and https://www.dol.gov/ui/data.pdf, December 17, 2020. Share Tweet Embed Download image
Senate Republicans allowed Federal Pandemic Unemployment Compensation (FPUC), the across-the-board $600 increase in weekly UI benefits, to expire at the end of July. That means last week was the 20th week of unemployment in this pandemic for which recipients did not get the extra $600. And, PUA and PEUC will expire on December 26, unless Congress acts. Millions of workers are now depending on these programs. The Department of Labor (DOL) reports that a total of 14.0 million workers were on PUA (9.2 million) or PEUC (4.8 million) during the week ending November 28. If these programs are allowed to expire, millions of these workers and their families will be financially devastated.
Another thing to remember in all this is that with the pandemic UI provisions, 39 weeks is the maximum number of weeks of UI most people can claim (either 26 weeks of regular benefits + 13 weeks of PEUC, or 39 weeks of PUA). Given that we are now 39+ weeks into this crisis, Congress must not only extend the pandemic programs, it must also add additional weeks of eligibility. It is clear that 39 weeks is not enough.
The House of Representatives passed a $3 trillion relief package in May, but Senate Majority Leader Mitch McConnell had, until now, blocked additional COVID-19 relief. But now, a $900 billion bipartisan relief and recovery bill appears poised to pass. This bill would reportedly provide a 10-week extension of both PEUC and PUA, and reinstate FPUC. The 10-week extension is wholly insufficient—it ensures millions will exhaust benefits before the end of February, as the virus surges and job openings remain scarce. Further, FPUC would be reinstated at only $300 per week, not $600. Though far better than nothing, the $300 is less than what is needed.
One reason it’s unfortunate FPUC was reduced to $300 is that UI is great stimulus. Reinstating the full $600 would create or save 3.3 million jobs; the $300 will create or save just half that. There are now 26.1 million workers who are unemployed or otherwise out of work because of the virus, or who have seen a drop in hours and pay because of the pandemic. And job growth has slowed dramatically. Stimulus is desperately needed. To get the economy back on track in a reasonable timeframe, policymakers should pass roughly $3 trillion in fiscal support, with the first $2 trillion hitting the economy between now and mid-2022 and, to avoid a fiscal cliff that causes unemployment to drift back up after that, another $1 trillion over the following couple of years.
That means that even if the bill being considered now passes, more stimulus will be needed early next year, because what is being considered now is not enough. A key missing piece from the bill is aid to state and local governments, which is crucial to a speedy recovery. However, Senate Majority Leader Mitch McConnel demanded that if state and local aid were included in the bill, truly outrageous corporate immunity provisions must also be included. To reach a deal, both were dropped.
Not enacting more stimulus, such as state and local aid, will slow the recovery and will exacerbate racial inequality. Due to the impact of historic and current systemic racism, Black and Latinx communities have seen more job loss in this recession and have less wealth to fall back on. Inadequate stimulus hits these workers the hardest. Further, workers in this pandemic aren’t just losing their jobs—millions of workers and their family members have lost employer-provided health insurance due to losing their jobs in the COVID-19 downturn.
The Economic Policy Institute (EPI) is a nonprofit, nonpartisan think tank created in 1986 to include the needs of low- and middle-income workers in economic policy discussions. EPI believes every working person deserves a good job with fair pay, affordable health care, and retirement security. www.epi.org